

Autor : Raquel Barros1,2* Liliana Raposo1,2 Nuno Moreira1 Margarida Rocha1 Paula Calaça1 Inês Spencer1 Diogo Caldeira3 Ana Sofia Oliveira1 Cristina Bárbara1,4
1 Centro Hospitalar Universitário Lisboa Norte - Hospital Pulido Valente. Departamento de NeumologĂa. Lisboa. Portugal 2Escola Superior de SaĂşde da Cruz Vermelha Portuguesa. Lisboa. Portugal 3ACes Lisboa Norte - Unidade de SaĂşde Familiar D. AmĂ©lia de Portugal 4Profesora Asociada con AgregaciĂłn da Faculdade de Medicina de Lisboa cristina.barbara@chln.min-saude.pt
Correspondencia :Raquel Barros rbarros@esscvp.eu
ABSTRACT
Introduction: The vital capacity (VC) can be determined by means of the expiratory
vital capacity (EVC) or the inspiratory vital capacity (IVC). Obtaining the
highest VC volume is essential for the correct interpretation of lung function
tests.
Objectives: To determine the differences between the EVC and the IVC (EVC-IVC)
according to the ventilatory pattern; to characterize
the FEV1/EVC and FEV1/IVC ratios when an
obstruction of the airways is detected; to study the effects of the EVC or IVC
on the detecÂtion of air trapping or lung hyperinflation.
Materials and Methods: Cross-sectional study. The sample included 388 individuals divided in 3
groups: healthy, airway obstrucÂtion, and restrictive lung disease. In order to
detect the airway obstruction, we studied the FEV1/EVC
and FEV1/IVC ratios. The presence
of air trapping or lung hyperinflation was determined by means of a lung volume
test. The differences between the EVC and the IVC (EVC-IVC) according to the ventilatory pattern were grouped into classes.
Results: In the normal group, there was an EVC-IVC difference of ≥ 200 ml
in 34.8% of the individuals; in the airway obstruction group, 28.4%, and in the
restrictive lung disease group, 22.4%. The FEV1/EVC
ratio detected airway obstruction in 44.8% of the individuals, and the FEV1/IVC ratio in 39.4%. In
patients with airway obstruction, the EVC maneuver determined the presence of
air trapping in 21.6% of subjects and lung hyperinflation in 9.5%. The IVC
maneuver showed 18.2% and 10.8%, respectively.
Conclusions: The EVC and IVC should not be used as interchangeable maneuvers,
considering the volume differences obtained with each one of them. Their
results influenced the interpretation of lung function.
Key words: Respiratory function testing, Measurement of lung volume, Vital
capacity, Airway obstruction, Lung capacity
Received: 04/20/2020
Accepted: 09/28/2020
Introduction
Vital capacity (VC) can be
measured forcibly (forced vital capacity, FVC) or slowly (slow vital capacÂity,
SVC), the latter being determined through the expiratory vital capacity (EVC)
or the inspiratory vital capacity (IVC)1.
The VC is influenced by the airway caliber and determining factors in total
lung capacity (TLC) and residual volume (RV)2.
Even though Hutchinson3
defined the VC as the maximum volume of expired gas after a maximun inspiration (EVC), and it is the most commonly used
method, the maneuver is frequently performed inversely (IVC). It is reasonable
to expect similar VCs obtained through both the inspiratory and expiraÂtory
maneuvers; however, differences were observed in some individuals with
pulmonary emphysema4.
The VC analysis is essential for
the interpretation of lung function tests results. The correct determiÂnation
of the VC is fundamental to the calculation of the TLC; also, its partial flow conditions
the value of the RV and, consequently, of the TLC, preventing the detection of
air trapping, lung hyperinflation and restrictive lung disease5-7.
The VC is also important to
determine the presence of airway obstruction; according to the American
Thoracic Society/European Respiratory Society (ATS/ERS)8, the presence of
this type of ventilatory defect is defined by the
decrease in the ratio between the maximum expiratory volume in the first second
and the greatest vital capacity (FEV1/VC).
The denominator in this ratio may include the forced vital capacÂity (FVC) or
the slow vital capacity (SVC) (EVC or IVC), depending on which has the highest
volume9.
Once the SVC can be determined by
the EVC or the IVC, it is considered very important to understand which one of
these methodologies allows for the highest volume, given that the VC is usually
obtained through one of them and not both. So, the FEV1/EVC
or the FEV1/IVC ratio can be used,
where the most sensitive to the detection of an airway obstruction is that
which includes the larger denominator.
The objectives of this study
were: 1) to determine the differences between the EVC and the IVC (EVC-IVC)
according to the ventilatory pattern; 2) to
characterize the FEV1/EVC
and FEV1/IVC ratios and their
capacity of detection of an airway obstruction; 3) to study the consequences of
performing the EVC or IVC in the detection of air trapping or lung
hyperinflation; 4) to understand the impact of the EVC or IVC on the degree of
severity of the restrictive lung disease; 5) to verify the existence of an
association between the EVC-IVC parameter and the FEV1,
TLC, RV and FRC (functional residual capacity) variables.
Materials and Methods
The study is prospective,
quantitative and cross-sectional. The sample consists of individuals who
underwent lung function tests between January and June 2017 at the Respiratory
Physiopathology Unit of the Hospital Pulido Valente -
Centro Hospitalar Universitário
Lisboa Norte – Portugal. The research was approved by
the Ethics Committee of the Centro Hospitalar Universitário Lisboa Norte and
the Lisbon Academic Medical Center.
The inclusion criteria were age
> 18 years and internal prescription of functional respiratory tests,
including spirometry and whole-body plethysmography. The exclusion criteria were:
non-compliance with the quality standards established by the ATS/ERS1,10 rules; having underwent
inhalation therapy before the tests; the presence of mixed ventilatory
defects and air trapping or lung hyperinflation criÂteria in the absence of
airway obstruction.
The individuals went to the Unit
to perform lung function tests, and the objective of the research has been
explained to them. We verified inclusion and exclusion criteria in those
individuals who acÂcepted to participate in the study. The ones who were
eligible were given an informative document. After reading it, those who agreed
with the terms of the study signed an informed consent. The sample consisted of
388 individuals. The equipment used in this study was a Sensormedics®Vmax
Series AutoÂbox 6200 plethysmograph
(Yorbalinda, California, USA, 1998), calibrated daily
in accordance with the manufacturer’s rules. The reference equations used for
the tests have been proposed by the European Community for Coal and Steel11. The respiratory
function tests comply with the guidelines proposed by the ATS/ERS (Standardisation of Spirometry1 and Standardisation
of Measurement of Lung Volumes10.
The first technique was the
whole-body plethysmography to obtain the SVC through
the EVC and IVC. Three reproducibility attempts were made with a minimum
interval of three minutes between each. In one half of the sample, we first
determined the EVC (three EVC maneuvers) and immediately after that, the IVC
was determined (three IVC maneuvers). In the other half, we followed the
opposite procedure. The final value of the variables was the average of the
three reproducibility attempts. The spirometry was
performed after the plethysmography, avoiding the
potential muscle fatigue and the volume history1.
A three-minute interval was established between techniques.
The parameters acquired by the
whole-body plethysmography were shown taking into
account the type of SVC maneuver that was performed, that is to say,
calculating the average of each group of three EVC and IVC maneuvers, and
showing each one of the variables.
The airway obstruction has been
defined by FEV1/FVC, FEV1/EVC and FEV1/IVC
< 0.70, and five degrees of severity have been considered in accordance with
the ATS/ERS8.
The restrictive lung disease was determined by the existence of a TLC < 80%
and was classified, according to Mottram7,
into three degrees of severity. The TLC, taken into account for the definition
of the ventilatory pattern and degree of severity of
the underlying restrictive lung disease has been obtained considering the mean
value of the EVC and IVC maneuvers. Subsequently, a subanalysis
was made in relation to the degree of severity of the restrictive lung disease,
according to the type of expiratory maneuver that was performed (EVC or IVC),
based on the TLCEVC and
TLCIVC.
The presence of RVEVC
or RVIVC >
140%, FRCEVC or FRCIVC > 120% and TLCEVC or TLCIVC
< 120% was considered air trapping, and RVEVC
or RVIVC >
140%, FRCEVC or FRCIVC > 120% and TLCEVC or TLCIVC
≥ 120% were considered lung hyperinflation.
To complete the characterization
of the differences between the EVC and IVC according to the venÂtilatory
pattern, we made a subanalyisis that classified those
differences in three classes: 1) EVC-IVC (L-liters) ≤ 100
(ml-milliliters); 2) EVC-IVC (L) ≤ 200 ml and 3) EVC-IVC (L) > 200 ml.
100 ml, as proposed by Mottram7,
were established for the minimum limit of differences.
For the characterization of the
sample, we used descriptive statistical methodologies. In the case of
quantitative variables, we used measures of central tendency (sample mean) and
measures of disperÂsion (deviation-pattern). Regarding the qualitative
variables, we used frequency distribution. We used the Kolmogorov-Smirnov Test
to check if the distribution of variables was a normal distribution. If the
variables under consideration followed this type of distribution, parametric
statistical methods were applied. We used the One-Way Anova
Test with Post Hoc Multiple Comparisons through the Tukey
Test for the purpose of understanding if lung function variables were
significantly different among the three defined ventilatory
groups. In the airway obstruction and restrictive lung disease groups we
evaluated possible differences in the variables EVC (L and %), IVC (L and %)
and EVC-IVC (L and %) relating to the degrees of severity of ventilatory defects. We used the One-Way Anova with Post Hoc Multiple Comparisons through the
Hochberg’s GT2 Test. In order to study the connections between the EVC-IVC
parameter (L and %) and the FEV1%,
TLC%, FRC% and RV% variables, we made the Pearson Correlation Test. For every
statistical test, the significance level was 0.05.
Results
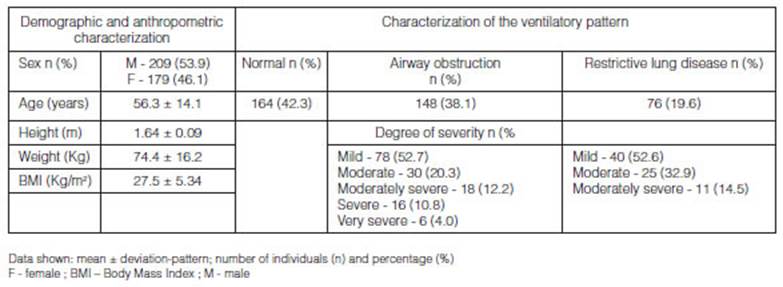
The sample consisted of 388
individuals; 209 male (53.9%) and 179 female (46.1%). It was confirmed that
42.3% of the subjects had a normal ventilatory
pattern; 38.1% had airway obstruction and 19.6% had restrictive lung disease.
We observed that most patients of the airway obstruction and restrictive lung
disease groups showed mild ventilatory defect (52.7%
and 52.6%) (Table 1).
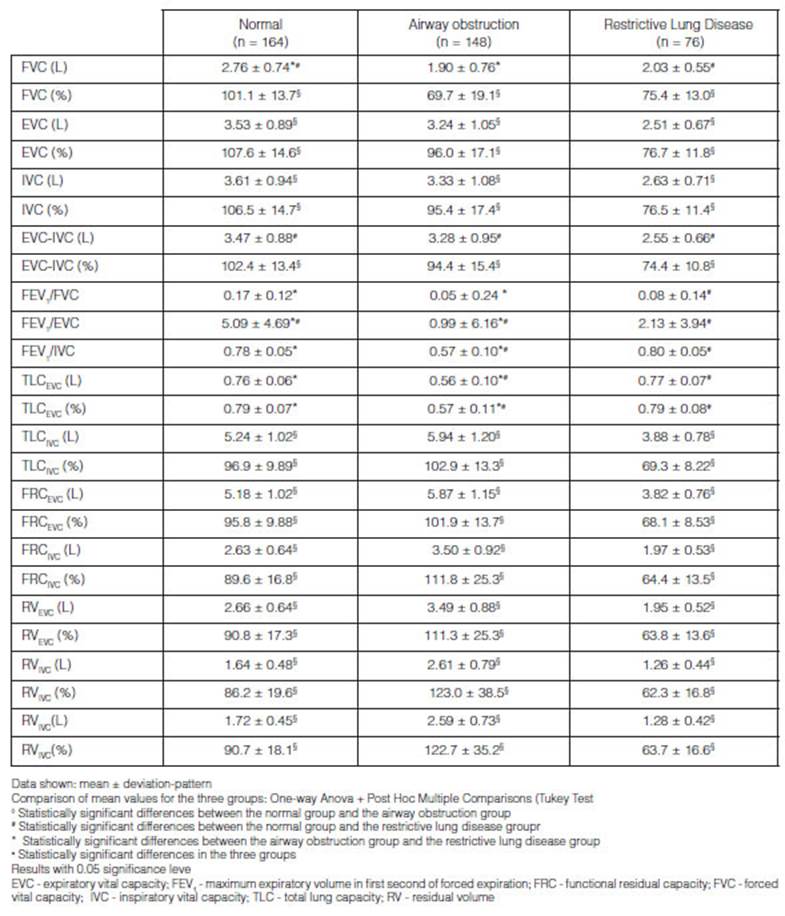
Through the analysis of lung function
variables obtained from the three established groups, we verified the existence
of statistically significant differences (p < 0.05) in the mean values of
the EVC-IVC (L and %) and FEV1 (L)
parameters between the normal vs. airway obstruction and normal vs. restrictive
lung disease groups. The mean values of the FEV1/FVC,
FEV1/EVC and FEV1/IVC ratios were statistically
different (p < 0.05) in the three groups. The mean value for the EVC was
higher than the mean IVC in all the lung function groups. The highest mean
value for EVC-IVC -170 mL and 5% - was confirmed in the normal ventilatory pattern group (Table 2).
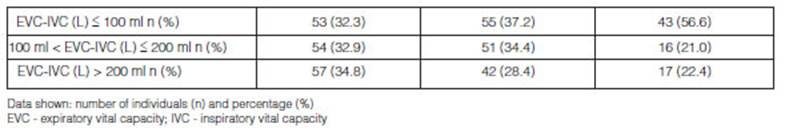
In the group with a normal ventilatory pattern, the difference between the EVC and IVC
(L) was < 100 ml in 32.3% of the individuals; between 100 ml and 200 ml in
32.9%, and > 200 ml in 34.8%. In the group with airway obstruction, those
differences were 37.2%, 34.4% and 28.4%. And in the group with restrictive lung
disease, the differences were 56.6%, 21.0% and 22.4% (Table 3).In the
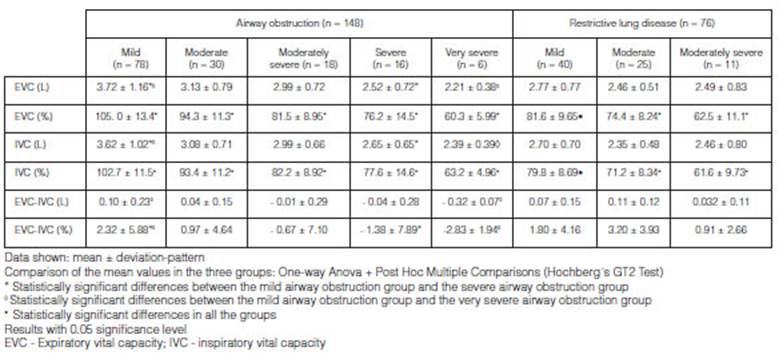
group with airway obstruction, we confirmed that the
mean value for the EVC (L), IVC (L) and EVC-IVC (%) parameters had a
statistically significant difference (p < 0.05) between the mild vs. severe
and mild vs. very severe groups. The mean value for the EVC-IVC (L) parameter
in the group with mild airway obstruction was significantly different (p <
0.05) from that verified in the group with very severe obstruction. The EVC
mean values (%) were statistically different (p< 0.05) in all the groups
with different airway obstruction degrees of severity. In the group with
restrictive lung disease, the mean values for the EVC (%) and IVC (%) variables
were significantly different (p < 0.05) in the three degrees of severity for
ventilatory deÂfects. With regard to the remaining
parameters, no statistically valuable differences have been confirmed (p >
0.05). In the group with airway obstruction, the mean values for the EVC (L and
%) were proven to be higher than the IVC (L and %) in the mild and moderate
degrees; however, in the severe and very severe degrees, the IVC mean value (L
and %) was higher than the EVC (L and %) (Table 4).
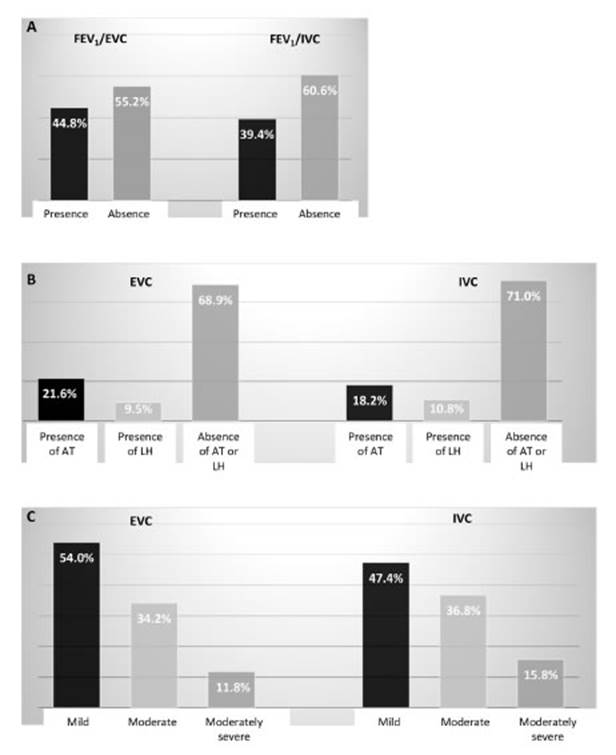
The FEV1/EVC
ratio of < 0.70 identified the presence of airway obstruction in 44.8% of
the overall sample, and the FEV1/IVC
ratio of < 0.70 in 39.4% (Figure 1A). In the group of individuals
with airÂway obstruction, the whole-body plethysmography
performed with the EVC maneuver determined the presence of air trapping in
21.6% of the elements and lung hyperinflation in 9.5%, whereas the IVC maneuver
determined the existence of air trapping in 18.2% of the elements and lung
hyperinflation in 10.8% (Figure 1B). In the restrictive lung disease
group, the TLCEVC analysis classified
the restrictive lung disease as mild in 54.0% of the individuals, moderate in
34.2% and moderately severe in 11.8%. The TLCIVC
analysis classified the disease as mild in 47.4% of the subjects,
moderate in 36.8% and moderately severe in 15.8% (Figure 1C).
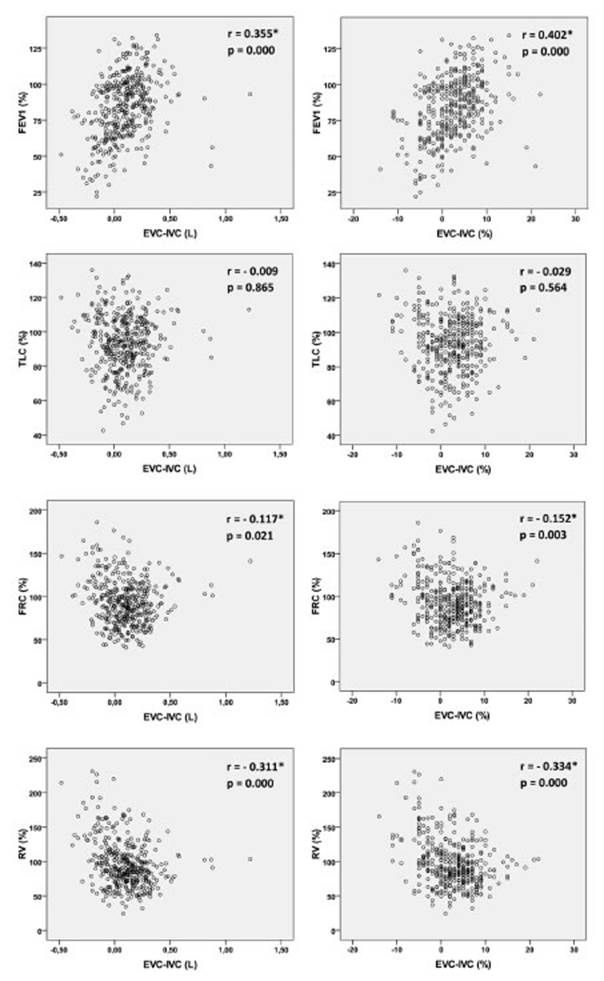
Taking into account the overall
sample, we verified the existence of a weak positive correlation (r=0.355;
p=0.000) between the FEV1 (%) and EVC-IVC (L) parameters, and a moderate
positive correlation (r=0.402; p=0.000) between the FEV1 (%) and EVC-IVC (%).
Weak negative correlations have been obtained between the FRC (%) and EVC-IVC
(L) and EVC-IVC (%) parameters (r=-0.117; p=0.021 and r=-0.152; p=0.003,
respectively) and between the RV (%) parameter and EVC-IVC (L) and EVC-IVC (%)
(r=-0.311; p=0.000 and r=-0.334; p=0.000 respectively) (Figure
2).
Discussion
The determination of the VC may
contribute to differences in the volumes obtained, due to its inherent
characteristics. This research confirmed that the use of the EVC or IVC
generates different VC volumes and consequent differences in lung volumes. We
observed that the use of the EVC, IVC or parameters not including the VC
classify patients differently regarding the lung function level. That is why
the authors indicate that the EVC and the IVC should not be considered
interchangeable maneuvers.
Few studies conducted several
decades ago addressed this topic. Bencowitz13 studied volume differÂences
between the EVC and IVC in sixty individuals (with and without obstruction,
jointly analyzed) and determined a mean difference of 79 ml. The author
considered it a minor difference, and suggested that the VC is similar with
both maneuvers. In a sample of six healthy individuals and six patients with
lung emphysema, the differences obtained by Hutchinson3 regarding
the EVC and IVC were similar between the groups (healthy - 20 ml and emphysema
- 60 ml). The analysis of the mean values didn’t show valuable differences
related to the EVC and IVC in any of the studies. On the contrary, this study
verified that the differences between the EVC and the IVC are more evident,
mostly in the group with a normal ventilatory pattern
(170 ml). In the groups with airway obstruction and restrictive lung disease,
those differences were 50 ml and 80 ml, respectively, being the EVC higher than
the IVC. According to Lutfi14, volume variations between the VC
types of maneuvers are slight in individuals with a normal ventilatory
pattern; however, that was not verified in this research, since it was in that
group that the greatest volume differences between the EVC and IVC were
observed.
The differences between the
results found in the literature and those obtained in this study could be
related to methodological characteristics, because the reported studies
analyzed a reduced number of individuals and didn’t group them according to
their ventilatory pattern. Taking into account the
results of this research, there are fewer differences in the group with airway
obstruction compared to the differences found in the group of normal
individuals; therefore, the joint analysis of the mean value shows lower
EVC-IVC values.
Through the analysis of
individuals with airway obstruction we confirmed a mean EVC higher than the
mean IVC (3.33 L vs. 3.28 L; p>0.05). The results obtained by the EVC and
IVC subanalysis acÂcording to the degrees of severity
of the obstruction revealed that in the mild and moderate airway obstruction
groups the mean EVC was higher than the mean IVC. However, in the groups with
severe and very severe obstruction the results were inverted, and the mean IVC
was higher than the mean EVC (there are more differences between the two VC
maneuvers as the severity of the ventilatory defect
increases). This particularity may be responsible for the similarity between
the mean EVC and IVC in the analysis of the obstruction group as a whole. The
results achieved by Brusasco et
al.4 in their research are similar to the results of this study: a
sample of twenty five individuals with obstruction obtained a mean EVC-IVC of
110 ml, where the IVC is higher than the EVC (the author didn’t divide the
sample according to the severity of the obstruction). The results obtained in
the group with airway obstruction agree with the literature; Sicar5
and Barreto6 report that in individuals with airway obÂstruction,
the IVC is higher than the EVC. The resistance of the airways is stronger
during expiration, compared to inspiration, because when the person expires
progressively the lung is less relaxed and the elastic recoil decreases. The
radial traction of the airways causes a decrease in their caliber, and the intrapleural pressure is higher during expiration, also
reducing de airway caliber14. This particuÂlarity justifies the
reason why in individuals with normal ventilatory
pattern and mild and moderate airway obstruction the EVC is higher than the
IVC; and in the most severe cases of obstruction, where a significant increase
in airway resistance is expected, the IVC turns out to be higher than the EVC.
According to the acceptance
criteria proposed by Mottram7, the VC maneuvers should not differ in
more than 100 ml. The results showed that, except for the group with restrictive
lung disease, where 56.6% of the sample had an EVC-IVC of less than 100 ml,
most individuals in the remaining groups had an EVC-IVC of more than 100 ml.
Bencowitz13 did not achieve a valuable mean value for the difÂferences
when he analyzed the differences between EVC and IVC individually, but he did
verify that in 63.3% of the sample individuals that difference was positive and
above 100 ml. This percentage was similar to that observed in the group with
normal ventilatory pattern and airway obstruction
(67.7% and 62.8%, respectively). These results alert us to the existence of
volume differences higher than the limit expected for reproducibility between
VC maneuvers (100 ml), which means that the EVC and the IVC are not equivalent
maneuvers.
Since the VC determines the
calculation of the RV and TLC, we analyzed the presence of air trapÂping or
lung hyperinflation in the airway obstruction group, basing on the following
variables: RVEVC and RVIVC, FRCEVC and FRCIVC, and TLCEVC and TLCIVC. We
confirmed that the EVC maneuver detected a larger number of subjects with air
trapping compared to the IVC maneuver (21.6% and 18.2%, reÂspectively). The
distribution of elements according to the categories (absence of air trapping
or lung hyperinflation and presence of lung hyperinflation) was not similar,
which means that the type of maneuver influences the characterization of lung
volumes.
The same type of analysis was
applied to the group with restrictive lung disease, taking into account the
TLCEVC and TLCIVC parameters. The same trend was confirmed in the results
because the distriÂbution of individuals relative to the degrees of severity of
restrictive lung disease has been different, according to the type of VC
maneuver that was performed. One possible explanation for obtaining a higher
amount of individuals with mild restrictive lung disease by TLCEVC, compared to
TLCIVC could be the fact that it is easier for the individuals to move an ERV
larger than the IRV.
This research evidenced the
existence of statistically significant associations among the FEV1%, FRC% and
RV% with differences between the EVC and IVC (EVC-IVC). After analyzing these
associations we could verify that there are more differences regarding the two
types of maneuvers in individuals with higher FEV1% and in individuals with
lower FRC% and RV%. Even though the correlation coefficient values were of mild
or moderate intensity, the fact that there is a statistical significance in
three out of four ratios under evaluation makes these associations valuable for
the authors. Bencowitz13 also studied the ratios between the FEV1
and RV/TLC and the differences between EVC and IVC, though the correlation
coefficients obtained did not have statistical importance.
The Chhabra15 study,
which included sixty asthmatic subjects and twenty individuals without any
respiratory disease, verified a FEV1/IVC ratio lower than the FEV1/EVC ratio in
both groups. The auÂthor considered the differences between the EVC and the IVC
as non-valuable, and didn’t analyse the repercussions
of using each ratio in the classification of individuals as obstructive or not
obstructive.
In this research, the FEV1/EVC
ratio determined the presence of airway obstruction in 44.8% of the
individuals, and the FEV1/IVC ratio in 39.4%; this means that the EVC was a
larger denominator than the IVC, allowing for a greater capacity to detect this
ventilatory defect. Taking into account what was
already mentioned in relation to the flow of larger volumes through the IVC in
subjects with obstruction, we would expect the ratio with greater capacity to
detect obstruction to be the FEV1/IVC. The authors explain this result stating
the fact that the EVC is higher than the IVC in mild and moderate obstrucÂtion
of the airways, creating a FEV1/EVC ratio lower than the FEV1/IVC. As regards
the groups with severe and very severe obstruction, a low FEV1 is obtained, so
the ratios are reduced as the numerator is reduced. So, both ratios detected
the presence of airway obstruction with these degrees of severity.
Conclusions
The results obtained from this
research show that the EVC and IVC should not be assumed to be identical
maneuvers because volume differences are obtained in each of them, and they condition
the interpretation of lung function tests. The EVC and IVC promote different
results relating to the charÂacterization of lung volumes (air trapping and
lung hyperinflation) and also promote variations in the classification of the
restrictive lung disease degrees of severity.
Considering the results obtained,
we suggest the use of the EVC in individuals with restrictive lung disease,
because the TLCEVC allows for a safer classification of the ventilatory
defect degree of severity.
The authors suggest the use of
EVC in individuals with normal ventilatory pattern
and mild and moderate airway obstruction. The expiratory maneuver revealed a
larger airflow capacity, thus promotÂing a greater detection of airway
obstruction. Taking into account the particularities of the respiratory system behaviour in cases of more severe airway obstruction, the
IVC has larger airflow capacity under such circumstances, so, we suggest that
the VC is determined using the IVC maneuver in these subjects.
There wasn’t any financial
support for the development of this research.
None of the authors has conflicts
of interest to declare.
References
1. Miller MR, Hankinson J, Brusasco V et al. Standardisation
of spirometry. Eur Respir
J. 2005; 26: 319-38.
2.
Barros R, Pires M, Raposo N. Importância da capacidade vital lenta na detecção de obstrução das vias aéreas. J Bras Pneumol. 2013; 39(30): 317-22.
3. Hutchison D, Barter C, Martelli N. Errors in the measurement of vital capacity - A
comparison of three methods in normal subjects and in patients with pulmonary
emphysema. Thorax. 1973; 28: 584-87.
4. Brusasco
V, Pellegrino R, Rodarte JR. Vital capacities in
acute and chronic airway obstruction: dependence on flow and volume histories. Eur Respir J. 1997; 10: 1316-20.
5. Sircar
S. Principles of Medical Physiology, 2nd edition. Georg Thieme Verlag; 2008.
6. Barreto
S. Volumes pulmonares. J Pneumol. 2002; 28(Suppl):
3.
7. Mottram C. Ruppel´s Manual of
Pulmonary Function Testing, 11th Edition. Elsevier; 2018.
8. Pellegrino R, Viegi G, Brusasco V et al.
Interpretative strategies for lung function tests. Eur Respir
J. 2005; 26: 948-68.
9. Allen SC, Charlton C, Backen W, Warwick-Sanders M, Yeung
P. Performing SVC in older people with and without cognitive impairment. Age
and Ageing. 2010; 39: 588-91.
10. Wanger
J, Clauses JL, Coates A et al. Standardisation
of the measurement of lung volumes. Eur Respir J. 2005; 26: 511-22.
11. Quanjer
H, Tammeling GJ, Cotes JE, Pedersen OF, Preslin R, Yernault J-C. Lung
volumes and forced ventilatory flows: ReÂport working
Party - Standardization of lung function tests - European Community for Steel
and Coal - Official Statement of the European Society. Eur Respir
J. 1993; 6: 5-40.
12. Pakhale
S, Bshouty Z, Marras T.
Comparison of per cent predicted and percentile values for pulmonary function
test interÂpretation. Can Respir J. 2009; 16(6):
189-93.
13. Bencowitz H. Inspiratory and expiratory vital capacity. Chest. 1984; 85: 834-5.
14. Lutfi
M. Vital capacity derived spirometric measurements. Sudan
Med J. 2012; 48(2): 86-100.
15. Chhabra
S. Forced vital capacity, slow vital capacity, or inspiratory vital capacity:
which is the best measure of vital capacity? J Asthma.
1998; 35(4): 361-5.186

| GalerĂa de imágenes | ||
| Mujer joven con afectaciĂłn pulmonar bilateral y alteraciĂłn de la conciencia | ||
Autores: Churin Lisandro |
 |
|